

By Nick Butler
Tags: Agile , Development
This case study follows my post on reducing risk with Agile transparency. It shows how you can use Agile tools like visible boards to increase risk transparency, making it easier to manage these risks. It’s part of my guide to project risk management with Agile.
One of our long-running government clients manages the harvesting of data from disparate sources, aggregates them into a single data schema and provides a comprehensive search service to the data via an API. A number of websites are built on top of the API.
This project has been going for over five years and has been through a number of major architectural changes. Initially the front end (the part the external world can touch including the API) was a set of Ruby on Rails applications, while the back-end (the object model, ingestion of data and search services) was a set of Java applications. Now, all layers of the application are in Ruby on Rails. Solr is used for search and indexing, and data is stored in a noSQL database.
The project has a large number of interlocking pieces and relies on several different applications, frameworks and databases.
During a retrospective, one of the teams identified the management of the interlocking systems and the visibility of technical debt as a core issue for the project. Technical debt affects the ongoing productivity of the team and the stability of the project, as this post on managing technical debt shows. The team put their heads together and determined that our lack of visibility into the system was the cause of the issue. We needed more risk transparency.
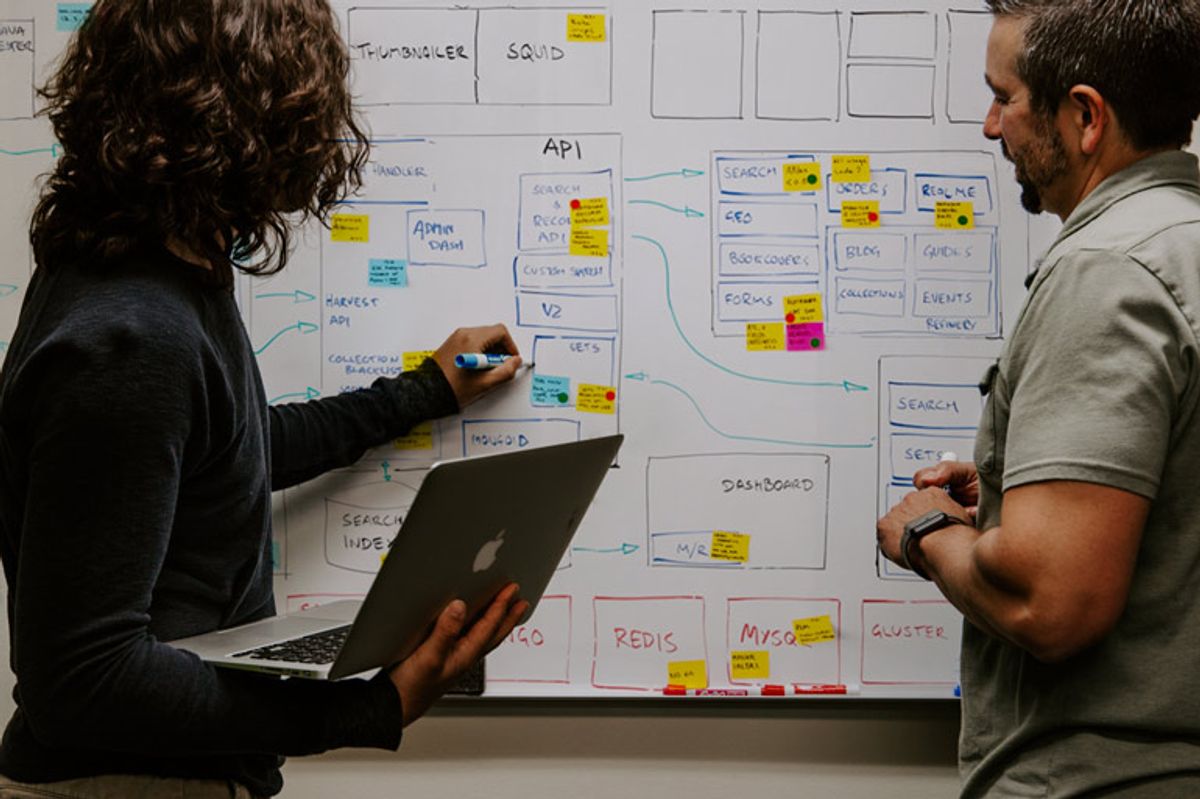
The team proposed a small experiment. They would construct a new whiteboard to sit along the team’s Scrum taskboard. The new board would outline the current state of the system and provide a high degree of risk transparency to the teams and the product owner.
The System Board, as the new board was called, was essentially a block diagram of the system. The team decided to overlay this block diagram with additional information using a simple system of coloured stickies to identify the issues they wished to track.
On top of this information, they used sticky dots to indicate that a story had been added to the backlog to address the specific issue.
It’s worth noting that the sticky dots were not part of the initial experiment. As experienced agilists, the team knew that they didn’t have all the answers when they designed the experiment. They were open to changing their approach. The sticky dots were the first of these changes. It wasn’t until a story was written for one of the issues that the team realised they also wanted to track this information, and they quickly came up with a solution.
The team wanted two benefits from the System Board. They would have current, living, easily updatable documentation of the structure of the system. They would also start to see patterns that could be insights into areas of particular fragility or technical debt.
Setting out the new information on a whiteboard was critical. The team could have decided to use an electronic document or the project’s wiki. However, there were three advantages to choosing the whiteboard.
First, the visibility of the whiteboard made the whole system much more transparent. If the information were stored in an electronic document, it would take greater effort on the part of individuals to look at it.
Second, it’s easy and instant to make changes to a whiteboard. This reduced the friction of change. The team gathered around the whiteboard at least once a day, which encouraged collaboration.
Third, the whiteboard was in a public place in our organisation. This had a democratising effect on the project, as the information was owned by the project and not a member or part of the team. Anyone could start a conversation based on the information.
With the new System Board in place, the team discovered they had a much better understanding of the overall system and its dependencies. This increased the risk transparency.
Because the pain points in the system were much more obvious, the product owner was able to prioritise work on these areas. As a result, the team started delivering even more value to the project.
For example, the background work queue was attracting a number of bugs and bad smells. The product owner wrote an investigation story to determine the extent of the issues. Then the team wrote and implemented a number of refactoring stories, improving the performance of the system while reducing the number of issues arising from it.
In addition, the product owner was less resistant to spend effort on issues of technical debt. Seeing this information day after day, the product owner was now just as aware as the team of the extent and implications of it.
Now that bad smells were more visible, the team saw them actioned more often. Overall, risk in the project was much more visible and could be mitigated and removed.
The team continued to make changes to the way the System Board worked.
For example, they added detail to the stickies about when an issue arose. Rather than a simple date, the team used a scheme that works for them because it added context. Each sticky had the years, the wave (3 month batch) and sprint noted at the bottom of the story.
The System Board was an excellent example of Agile documentation that was in service to the project’s outcomes. It was continuously and persistently updated. The team found it incredibly useful, and they made the System Board a permanent part of the project.
The team’s transparency meant they could raise an issue that they were concerned about without fear of sanction. The solution to the problem was a whiteboard that provided greater insight into the project’s structure, dependencies and technical debt. Transparency led to even more transparency and significantly reduced risk in the project.
Guidance Case studies & resources Introduction to project risk management with Agile Agile risk management checklist — check and tune your practice Effective prioritisation Reduce software development risk with Agile prioritisation Reducing risk with Agile prioritisation: IntuitionHQ case study Increasing transparency How Agile transparency reduces project risk Risk transparency: Smells, Meteors & Upgrades Board case study Limiting work in progress Manage project risk by limiting work in progress Reducing WIP to limit risk: Blocked stories case study Reducing batch size How to reduce batch size in Agile software development Reducing batch size to manage risk: Story splitting case study

